If you’re accessing your Workable data via Workable BI Data Link (Amazon Redshift) and are a Power BI user, you can connect to Amazon Redshift data from Power BI.
Connecting to Power BI
To connect Power BI to Amazon Redshift:
- Open Power BI Desktop (if you're using Power Query Online, check the connection steps here)
- Select the Amazon Redshift connector in the Get Data selection
-
Fill in the Server and Database fields with the values that our team will share with you
-
If this is your first time connecting to this database, enter your credentials under the Amazon Redshift authentication type
- Click Connect to complete the process
Next, you will be prompted to choose which data you want to import.
Building reports in Power BI
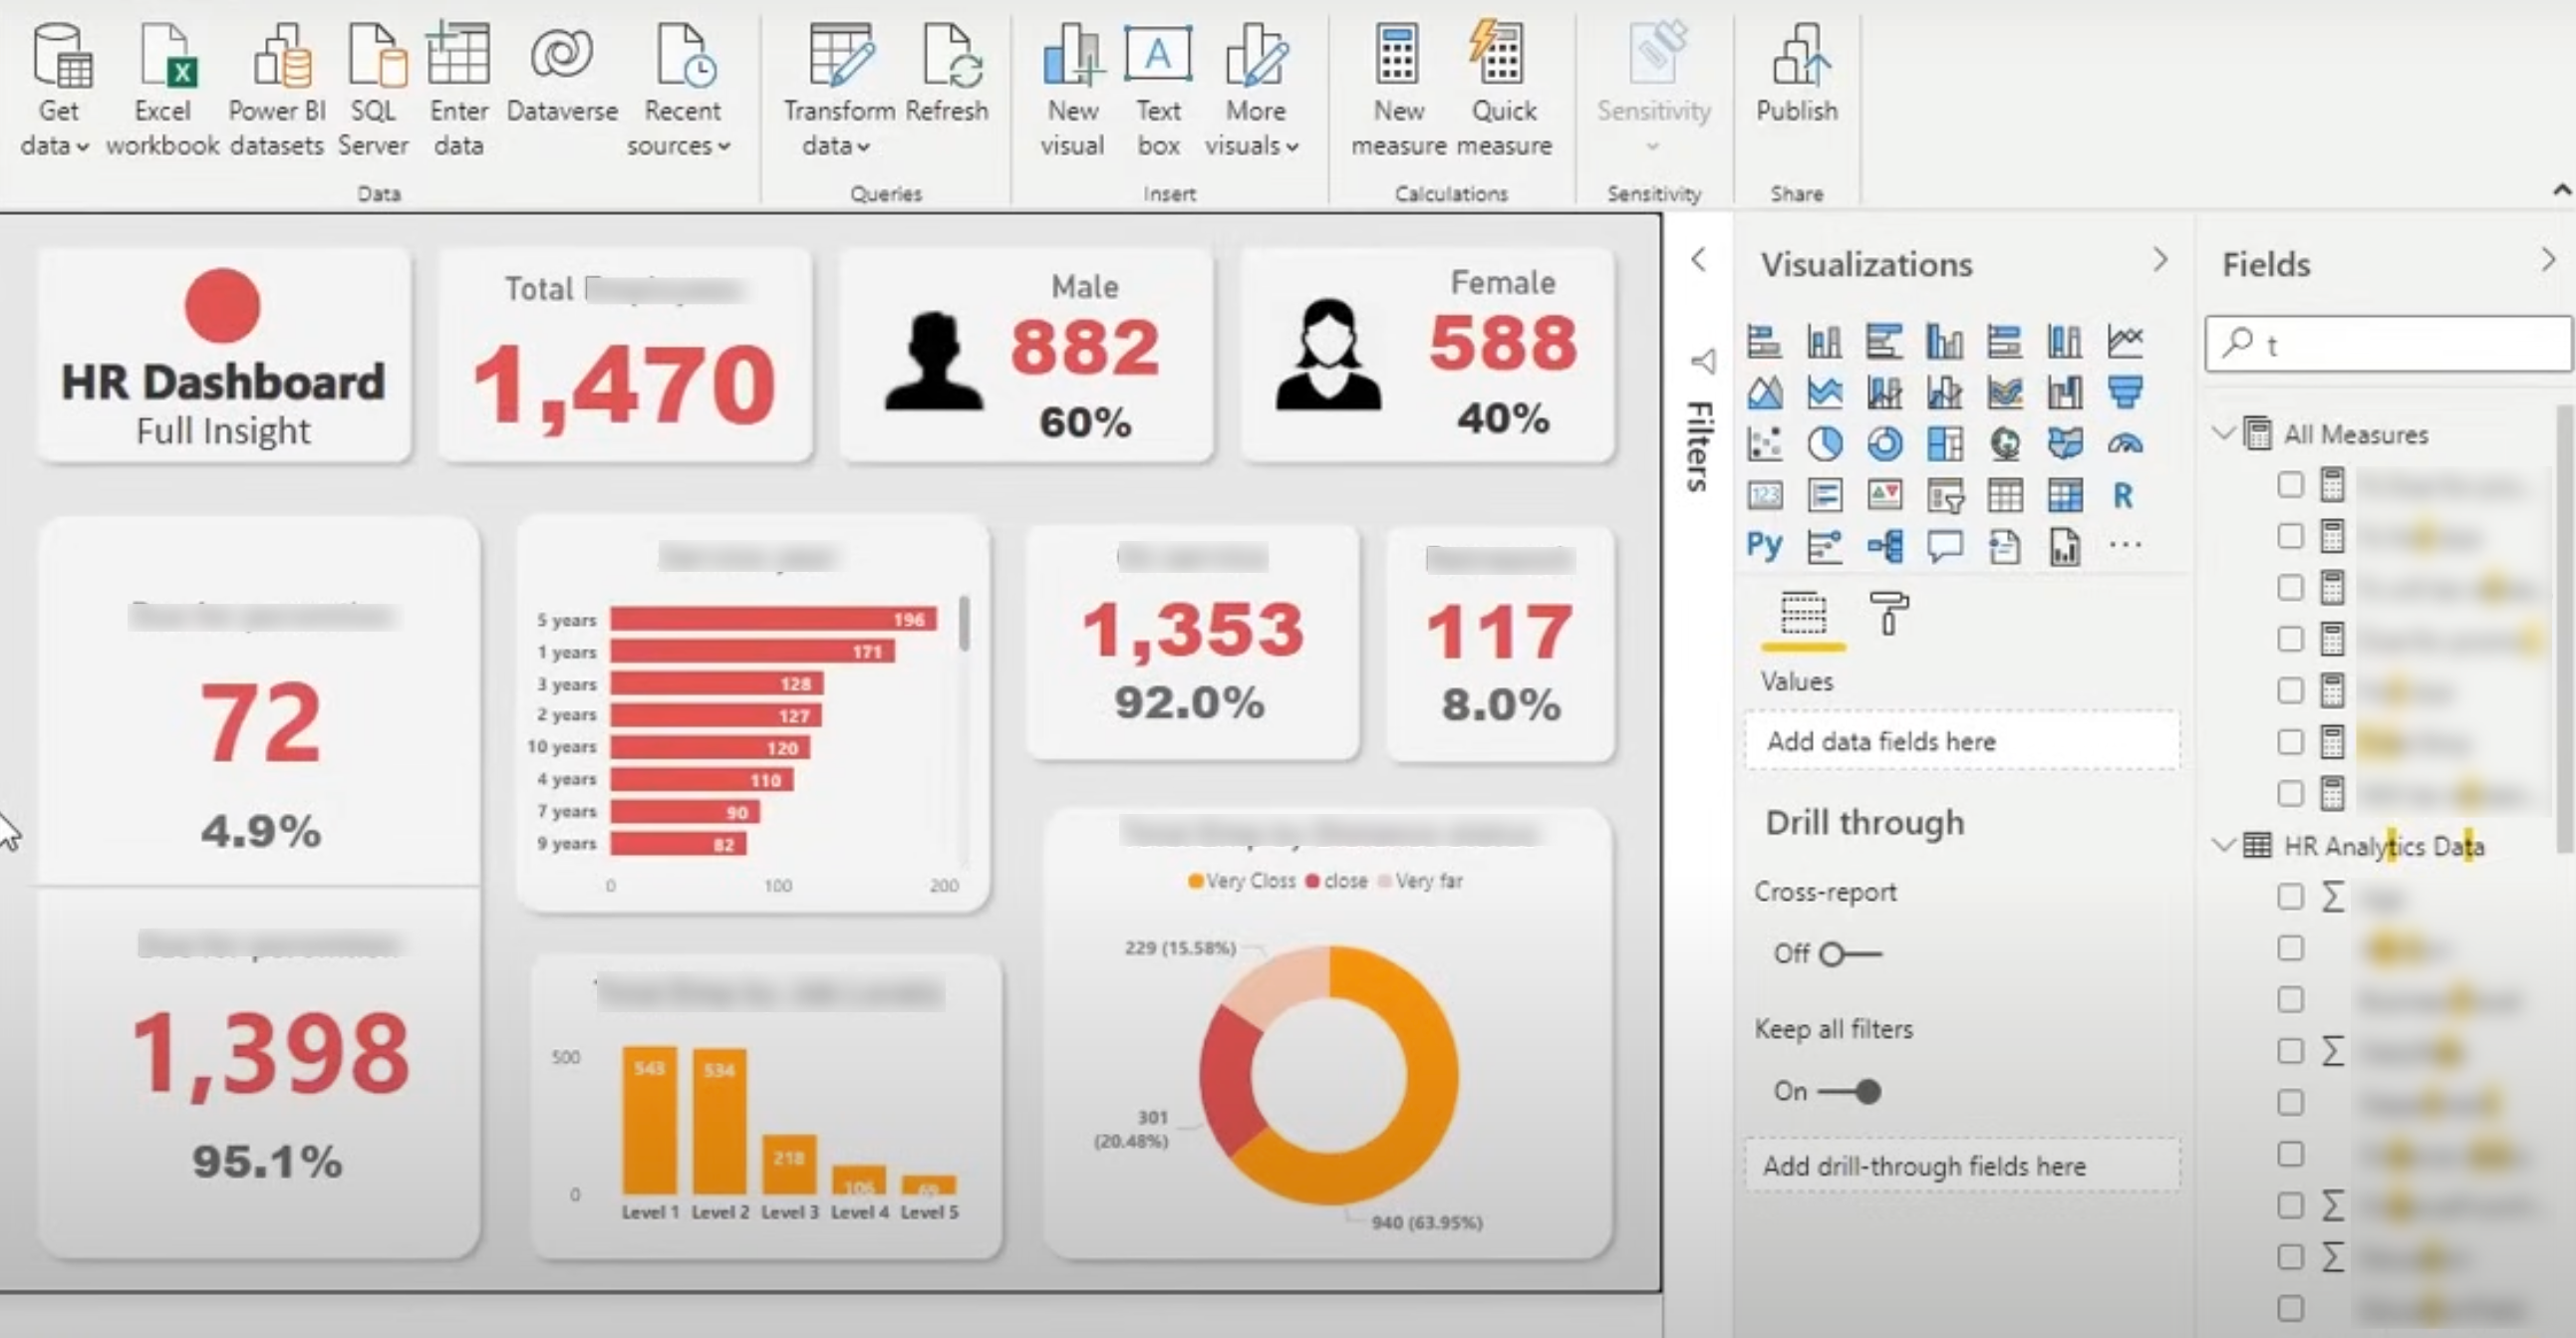
Once you've imported your data from Amazon Redshift into Power BI, you can start creating reports and dashboards by following these steps:
-
Define your requirements: Determine what insights you want to gain from your data and what key performance indicators (KPIs) you want to track.
-
Create and customize visuals: Based on your data, use Power BI's intuitive drag-and-drop interface to create visualizations such as charts, graphs, tables, and maps. Choose the appropriate visualization appearance and formatting for each KPI to communicate insights effectively.
-
Create dashboards: Combine multiple visuals into a dashboard to provide an overview of key metrics and insights at a glance.
